TL;DR:
Search Console API provides programmatic access to Google Search Console data via the `searchanalytics.query` endpoint
Core dimensions: query, page, device, country, search appearance — combine up to three per request
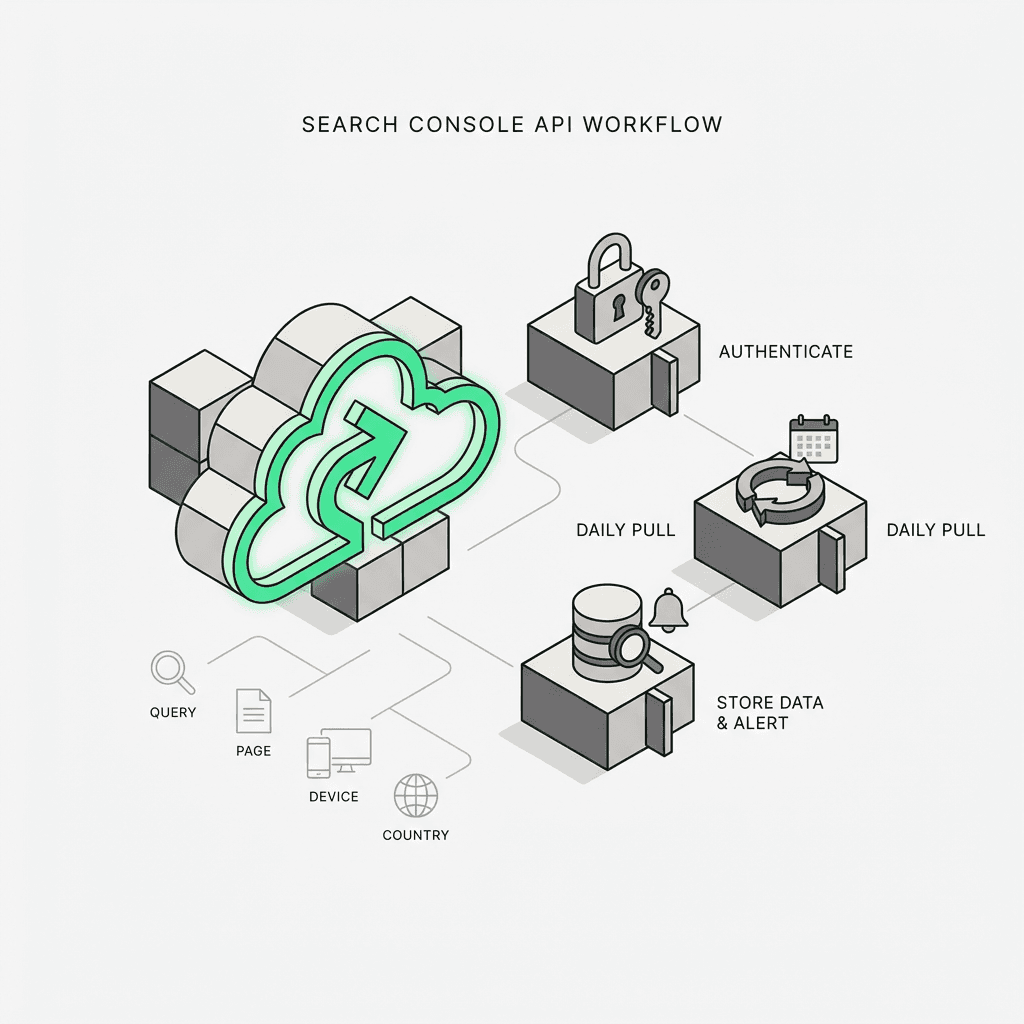
Tactical workflow: Authenticate → build daily pull → store in system → alert on anomalies
API quotas: 25,000 rows per request, 16 months of historical data, 1,200 queries/minute
Intelligent agents: The GSC API is the data backbone for modern SEO tools — it provides ground truth for intelligent automation
Platform advantage: Purpose-built for SEO workflows — versioned data pulls, anomaly detection, and alert triggers in a unified system
Best practices: Batch requests, store raw data, version queries, combine with other data sources for full-funnel insights, verify permissions and domain setup
Use cases: E-commerce product tracking, SaaS blog monitoring, agency client dashboards, publisher anomaly detection
Getting started: Follow this tutorial to set up authentication, enable the API in Google Cloud Console, add service account users with proper permissions, and start building your integration
Key resources: Official documentation, Python client library, example code, and step-by-step guide to help you learn the methods and tools available
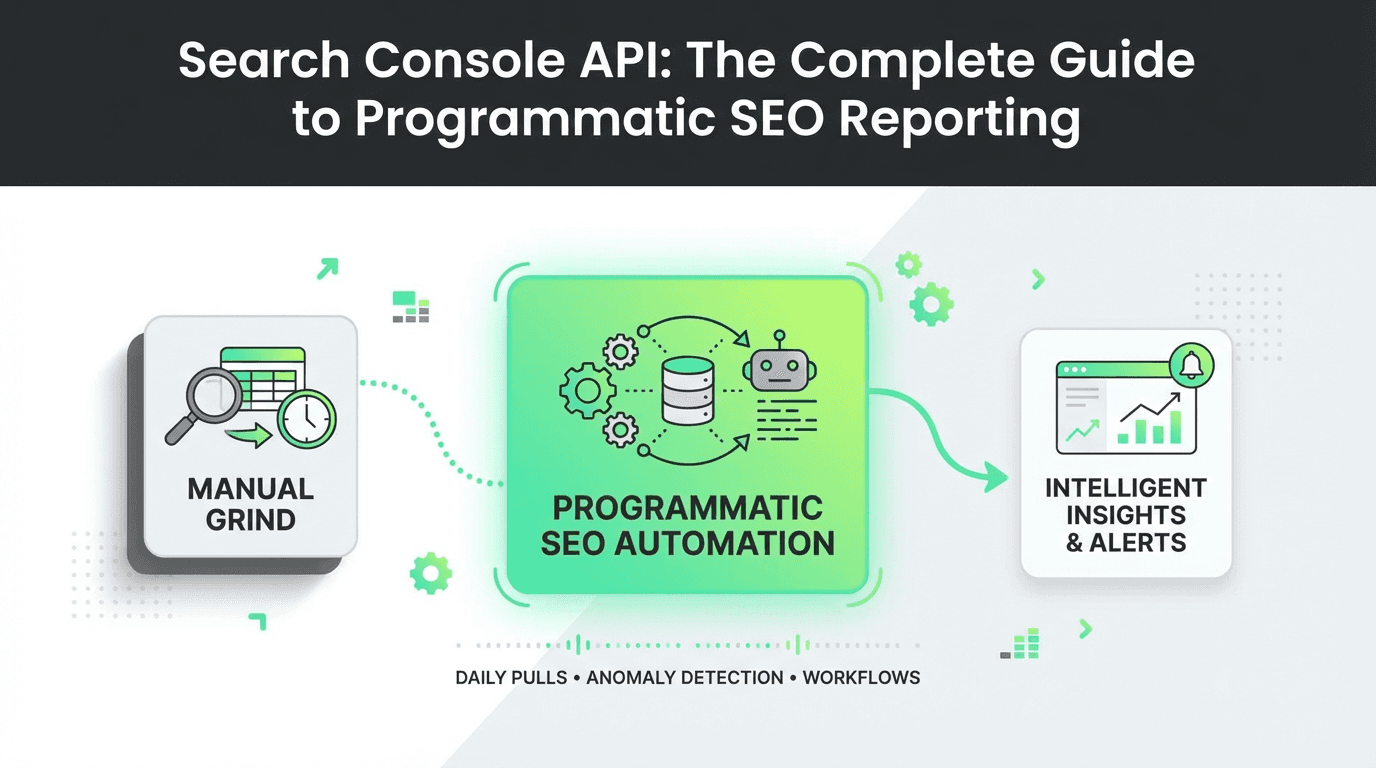
Every SEO professional has spent hours manually exporting data from Google Search Console, copying CSV files, and wrestling with spreadsheets. But what if you could automate the entire process — pulling fresh performance data every morning, segmenting it by query, page, device, and country, and triggering alerts the moment an anomaly appears?
That's exactly what the Search Console API makes possible.
The Google Search Console API is a programmatic interface that lets you extract Search Analytics data automatically, build repeatable reporting pipelines, and monitor SEO performance at scale. Instead of clicking through the GSC interface, you write code once and let it run forever — feeding dashboards, data systems, and intelligent decision engines with the ground truth of what Google sees.
In this guide, you'll learn how to use the searchanalytics query endpoint to automate performance extraction, build reusable query templates, and monitor your site by segment. We'll walk through tactical steps to set up daily pulls, structure dimensions, store data in your system, and detect anomalies before they cost you traffic. And we'll explore how modern SEO tools and marketing agents are transforming this workflow — turning raw API data into intelligent, autonomous optimization systems.
What Is the Search Console API?
The Search Console API is Google's official REST API for accessing the data that powers Google Search Console. It provides programmatic access to the same metrics you see in the GSC interface — impressions, clicks, CTR, and average position — but in a structured, queryable format.
The core endpoint is `searchanalytics.query`, which accepts parameters like:
Date range: Start and end dates for the query
Dimensions: Group results by query, page, device, country, or search appearance
Filters: Narrow results to specific queries, URLs, or countries
Row limit: Control how many rows are returned (max 25,000 per request)
This means you can pull yesterday's top 1,000 queries, segment mobile vs. desktop performance, or track how a specific landing page performs in different countries — all without touching the web interface. You can verify your property, add users with the appropriate permissions, and start extracting valuable insights about your website's search performance.
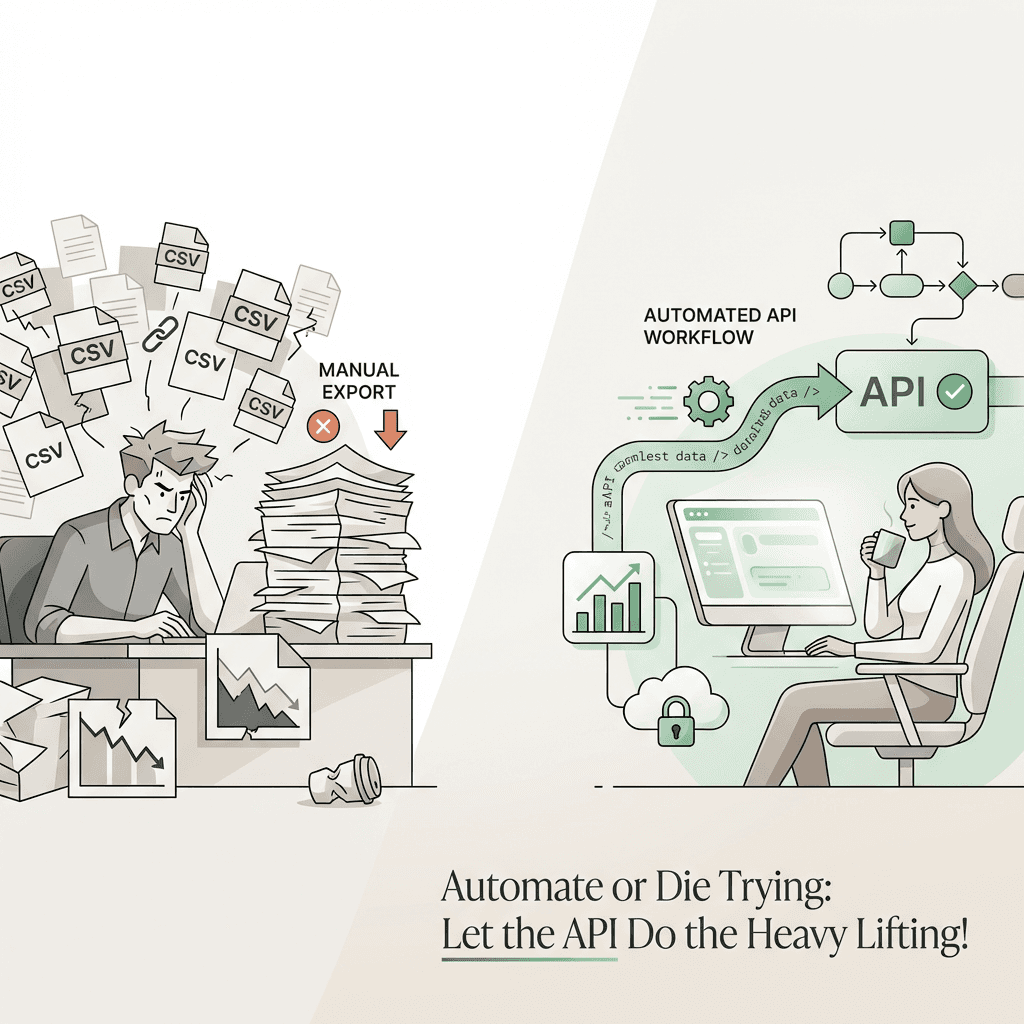
Why Use the GSC API Instead of Manual Exports?
Manual exports work fine for one-off analysis. But they break down when you need:
Daily monitoring: Automatically check performance every morning
Segmentation at scale: Compare hundreds of pages, queries, or countries
Anomaly detection: Spot sudden drops in impressions or CTR before they compound
Data storage: Store historical data beyond GSC's 16-month retention window
Cross-platform analysis: Combine GSC data with Google Analytics, CRM, or product metrics
The Search Console API turns SEO reporting from a manual chore into a repeatable, scalable pipeline. And when you pair it with SEO tools and marketing tools, you unlock a new level of intelligence — agents that don't just report data, but act on it.
Understanding GSC API Dimensions and Metrics
Before you start querying, you need to understand how the GSC API dimensions work. Dimensions are the axes along which you slice your data. The five core dimensions are:
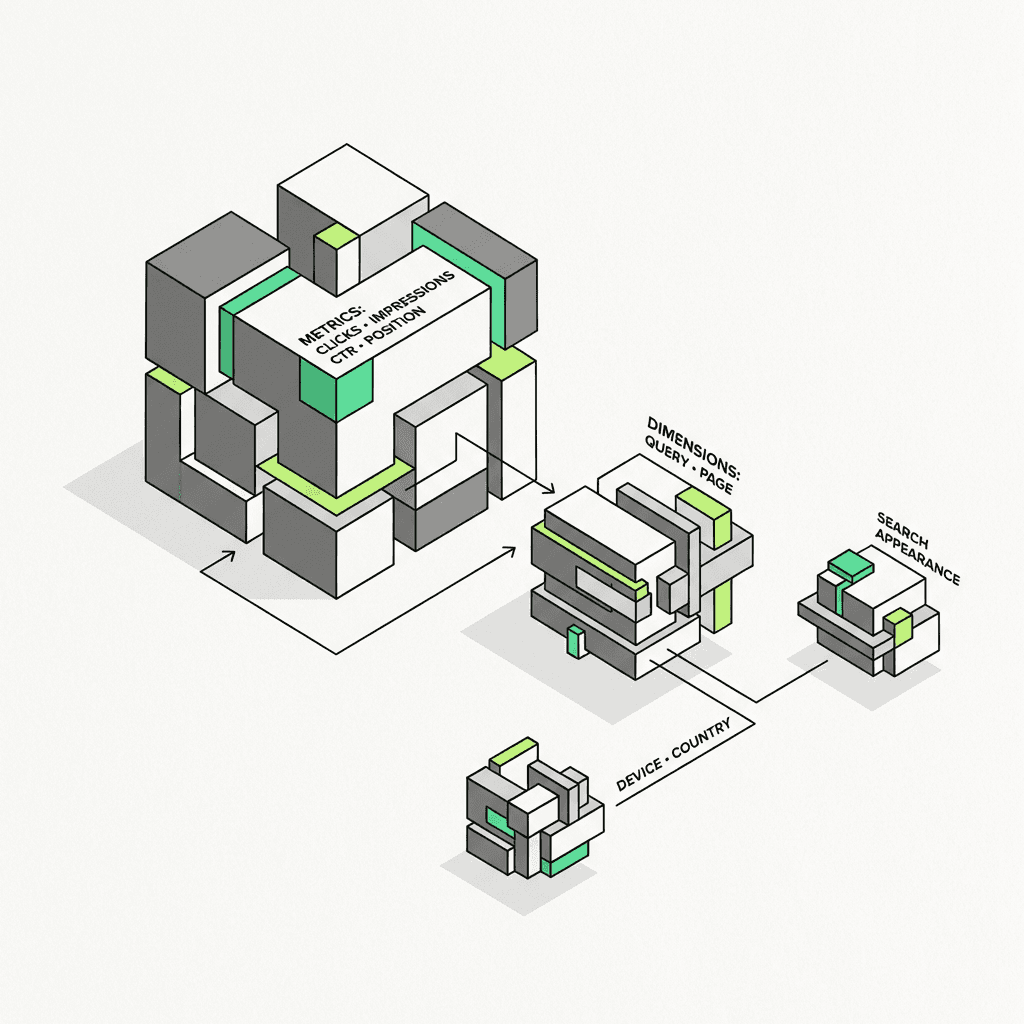
Query: The search term that triggered your result
Page: The URL that appeared in search results
Device: Desktop, mobile, or tablet
Country: The user's country (ISO 3166-1 alpha-3 format)
Search Appearance: Rich results, AMP, video, etc.
You can combine up to three dimensions in a single query. For example:
`query + page`: See which queries drive traffic to each URL
`page + device + country`: Understand how a landing page performs across segments
`query + country`: Identify geographic variations in search demand
Each row in the response includes four metrics:
Clicks: Number of clicks from search results
Impressions: Number of times your URL appeared in search
CTR: Click-through rate (clicks ÷ impressions)
Position: Average ranking position (lower is better)
These metrics provide essential information about how your website pages perform in Google search results across different devices and regions.
API Quotas and Rate Limits
The Google Search Console API has generous quotas, but you still need to respect them:
25,000 rows per request (use pagination for larger datasets)
1,200 queries per minute (rarely a bottleneck for most use cases)
16 months of historical data (older data is not available)
If you're pulling data for multiple sites or running hourly jobs, consider batching requests and caching results to stay within limits. For teams, pairing this with an automation solution for growth can help manage large-scale operations efficiently.
How to Use the Search Console API: Step-by-Step
Let's walk through the tactical steps to build a production-ready GSC API reporting pipeline. This tutorial will guide you through the setup process and help you get started with your first API integration.
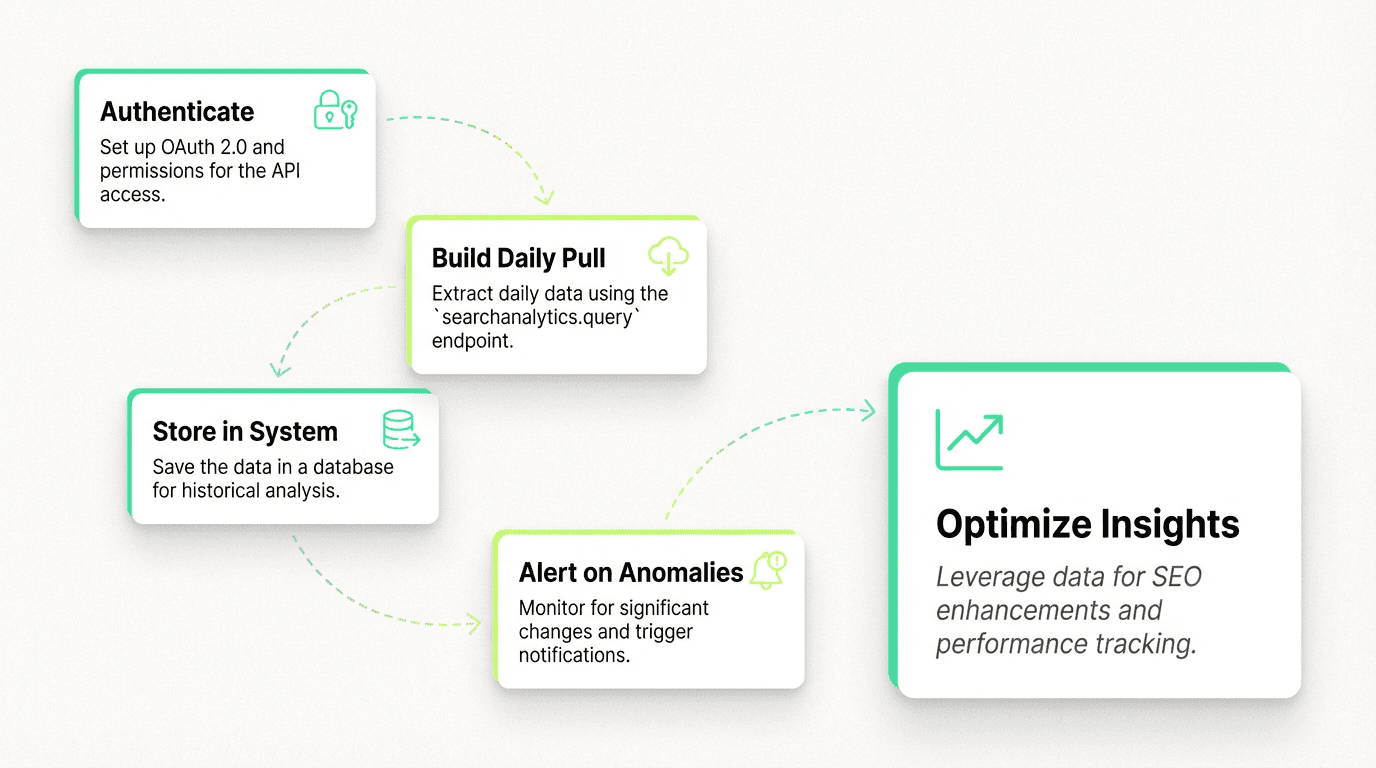
Step 1: Set Up Authentication
The Search Console API uses OAuth 2.0 for authentication. You'll need to:
Create a project in the Google Cloud Console
Enable the Search Console API in your project settings
Create OAuth 2.0 credentials (service account or OAuth client)
Authorize your application to access your GSC property
For server-side automation, a service account is the cleanest approach. You'll download a JSON key file and use it to authenticate requests. Make sure to add the service account email as a user with owner or full permission level in your Google Search Console property settings.
Step 2: Build Your First `searchanalytics.query` Request
Here's a Python example using the `google-api-python-client` library. This code demonstrates the basic method to query the API and extract performance data:
This pulls the last month of data, grouped by query, page, and device. You can filter by adding a `dimensionFilterGroups` parameter to narrow down results:
This returns the top 1,000 queries in the United States. You can see how different URL patterns perform and get detailed analytics about search performance across your site.
Step 3: Build a Daily Pull
To automate this, schedule a script to run every morning using available tools and methods. Use cron, Airflow, or a serverless function (AWS Lambda, Google Cloud Functions) to:
Pull yesterday's data from the console
Append it to a database or storage system
Run aggregations and anomaly checks
Send alerts if CTR drops or impressions spike
Here's a simple daily pull example in Python that demonstrates the setup:
This approach ensures you capture fresh data daily and can start building historical reports for your website properties.
Step 4: Store Data in a System
Google Search Console only retains 16 months of data. If you want to track year-over-year trends or train machine learning models, you need to store historical data in a database or analytics platform.
Popular choices available include:
BigQuery: Native integration with Google Cloud; fast SQL queries
Snowflake: Great for cross-platform analytics
Postgres: Simple, open-source, and cost-effective
Once your data is stored, you can run SQL queries to analyze CTR trends, identify underperforming pages, or segment by device and country:
This query helps you understand which pages and resources on your website drive the most web traffic and how users interact with your site.
Step 5: Alert on Anomalies
The real power of GSC API reporting is anomaly detection. You can build simple rules like:
If daily clicks drop by more than 20%, send a Slack alert
If a top-10 query's position drops below 15, flag it for review and create a report
If impressions spike but CTR drops, investigate title/meta issues and index problems
Or you can use statistical methods (e.g., ARIMA, Prophet, or simple moving averages) to detect outliers automatically and identify errors in your site's performance. For teams scaling this process, integrating an automation platform can further streamline and enhance detection and response capabilities.
Modern SEO Tools and the Future of Search Console Automation
Here's where things get interesting: the Search Console API isn't just a reporting tool — it's the data backbone for intelligent agents.
Every automated SEO system needs three things:
Ground truth data: What Google actually sees (not what you think it sees)
Historical context: Trends, seasonality, and baseline performance
Real-time signals: Anomalies, spikes, and drops that require action
The Search Console API provides all three resources. And when you pair it with marketing agents and content marketing tools, you can build applications that:
Auto-optimize titles and meta descriptions based on CTR performance
Detect content decay and trigger rewrites when rankings drop
Prioritize content creation by identifying high-impression, low-CTR queries
Monitor competitor movements by tracking SERP shifts
How Modern Platforms Transform Search Console Workflows
This is where advanced automation platforms come in.
Traditional automation stacks force you to stitch together Zapier triggers, Google Sheets, and fragile Python scripts. You spend more time debugging connectors than building intelligence. Modern platforms are different — they're natural language agent builders and automation systems designed for growth teams who want to move fast without sacrificing rigor.
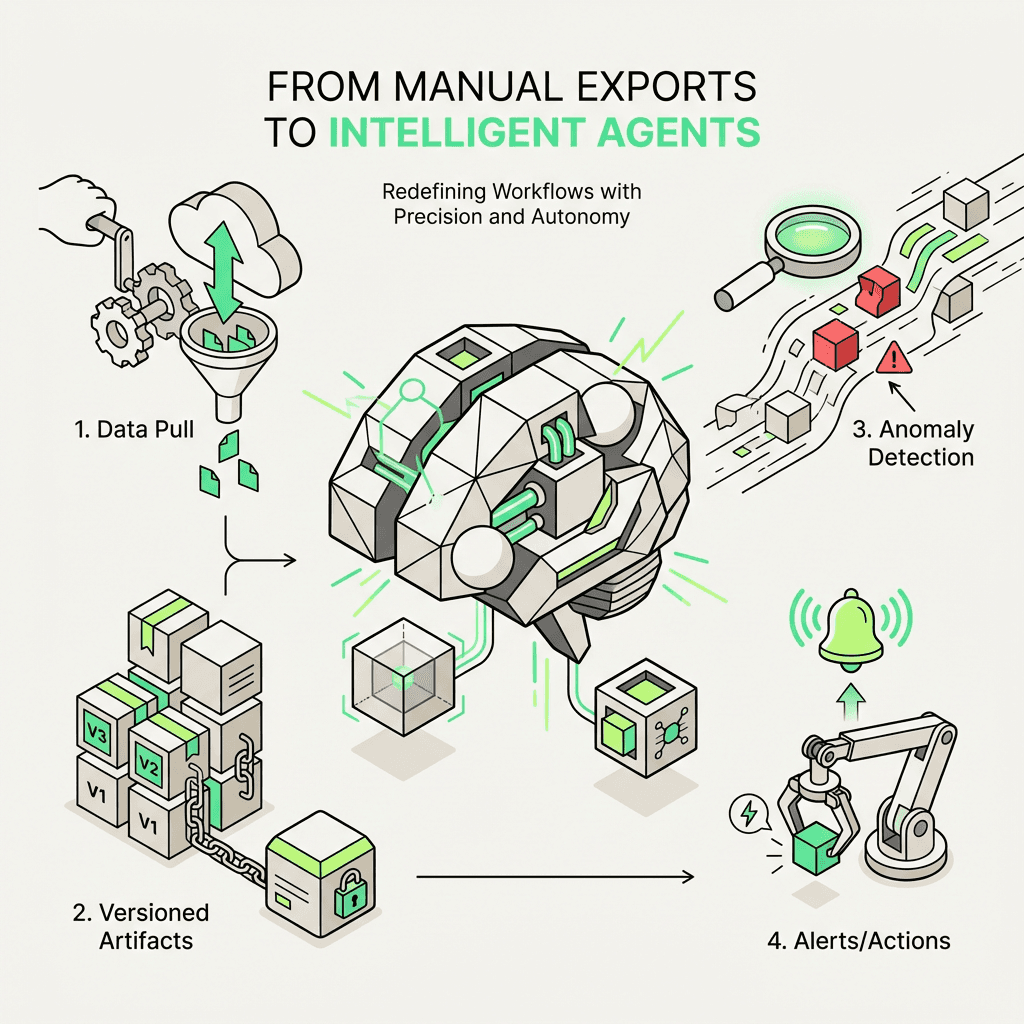
Here's how an automated agent handles Search Console data:
Daily data pull: A single step fetches yesterday's Search Analytics data via the `searchanalytics.query` endpoint
Versioned artifacts: Every day's data is stored as a versioned artifact, so you can rewind and compare
Anomaly detection models: A downstream step runs a Prophet model to detect outliers in clicks, impressions, or CTR
Trigger alerts: If an anomaly is detected, the agent sends a Slack message, creates a Jira ticket, or triggers a content audit workflow
All of this is defined in natural language and Python — no rigid connectors, no fragmented tools. You ideate, experiment, and codify insights into durable, scalable workflows.
Here's what an automated flow might look like using this approach:
This is the foundational flow that powers every other SEO agent in the system. It's repeatable, versioned, and intelligent — freeing your team from manual exports and giving you the cognitive bandwidth to focus on high-impact work using the best marketing tools.
Best Practices for Search Console API Reporting
Before we wrap up, here are a few best practices to help you get the most from your GSC API reporting pipeline and ensure smooth operations:
1. Respect API Quotas
Batch requests when possible and cache results to avoid hitting rate limits. Learn the documentation to understand quota restrictions.
2. Use Filters Wisely
Filtering by country, device, or search appearance can dramatically reduce row counts and speed up queries. This helps you access the specific information you need efficiently.
3. Store Raw Data
Always store raw API responses before aggregating. This lets you re-run analysis without re-querying the API and provides a complete audit trail.
4. Monitor Data Freshness
GSC data can lag by 24-48 hours. Build in checks to ensure you're not alerting on stale data and verify your reports are current.
5. Combine with Other Sources
The Search Console API is most powerful when combined with Google Analytics, CRM data, or product metrics. This gives you a full-funnel view of how search performance drives business outcomes across your properties.
6. Version Your Queries
As your SEO strategy evolves, your queries will change. Version your request templates so you can reproduce historical analysis and maintain consistency in your reports.
7. Set Up Proper Permissions
Make sure all team members and service accounts have the correct permission levels. Owner and user roles should be assigned based on what each account needs to access.
8. Enable Proper Verification
Ensure your domain verification is set up correctly before attempting API integration. This setup step is critical for successful authentication.
Real-World Use Cases
Here are a few ways teams use the Search Console API in production applications:
E-commerce: Track product page performance by device and country; auto-optimize titles for low-CTR queries with content strategy tools
SaaS: Monitor blog post rankings; trigger content updates when position drops and create detailed performance reports
Agencies: Build client dashboards that update daily; segment by brand vs. non-brand queries and provide insights across multiple properties
Publishers: Detect traffic anomalies in real time; prioritize content rewrites based on impression volume and help maintain site health
Each use case demonstrates how the API provides valuable insights and helps users make data-driven decisions about their website's search performance.
Conclusion
The Search Console API is the foundation of modern SEO automation. It transforms Google Search Console from a manual reporting tool into a programmable data source — one that feeds dashboards, databases, and intelligent decision engines.
By mastering the `searchanalytics.query` endpoint, you can automate performance extraction, build reusable query templates, and monitor your site by segment. And when you pair the API with SEO tools and modern platforms, you unlock a new level of intelligence — agents that don't just report data, but act on it.
Whether you're building daily pulls, storing data in your system, or detecting anomalies at scale, the Search Console API is the backbone of every marketing workspace. It provides the ground truth on what Google sees, gives you access to critical performance metrics, and helps your team make smarter, faster decisions about your website properties.
This guide has walked you through the essential steps to get started, from authentication and setup to building production-ready pipelines. With the right approach, proper permissions, and a solid understanding of the documentation, you can create powerful integrations that help you learn from your data and optimize your search performance continuously.