TL;DR:
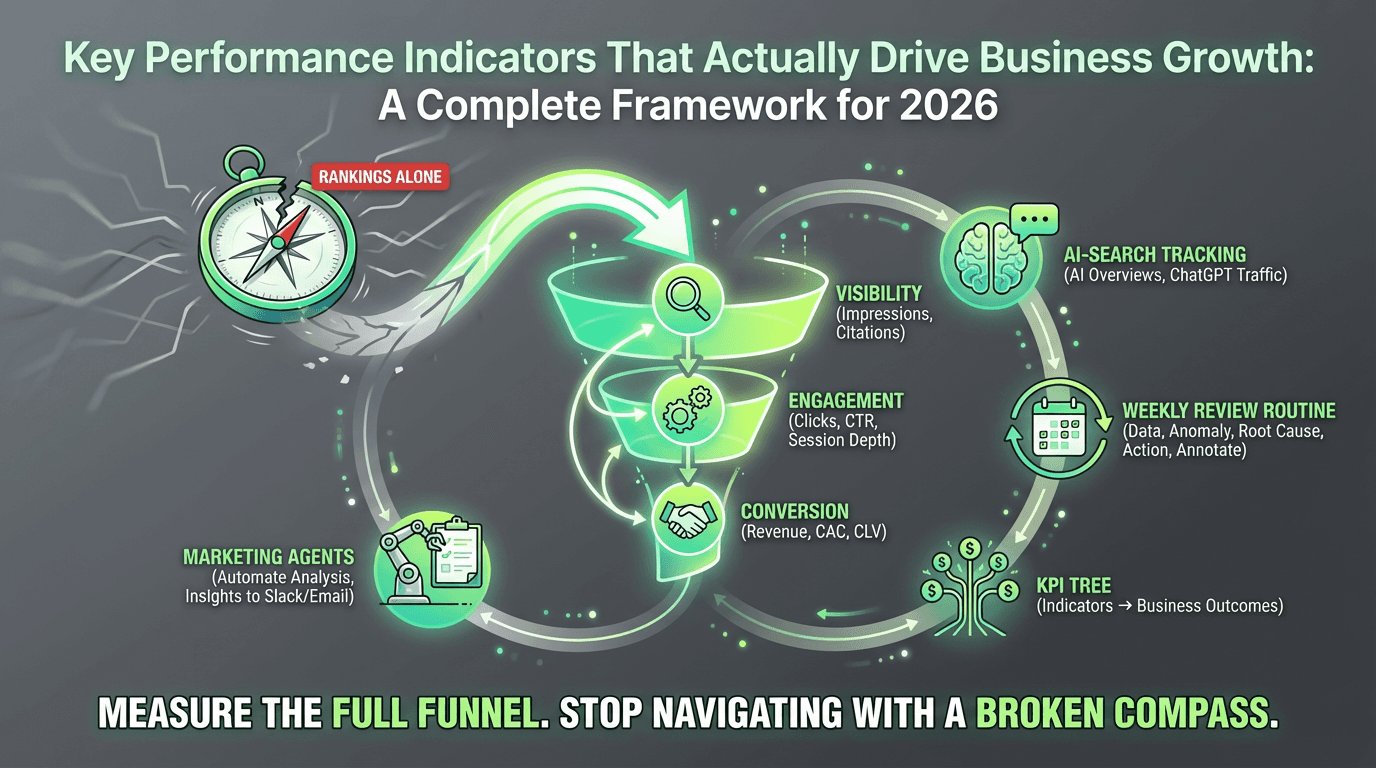
Rankings alone are misleading—measure the full funnel from visibility → traffic → conversion → revenue to prove ROI
Three-tier framework: Visibility (impressions, citations), engagement (clicks, CTR, session depth), and conversion (revenue, CAC, CLV)
AI-search performance tracking is now essential: Track citation frequency in AI Overviews, traffic from ChatGPT/Perplexity, and AEO visibility scores alongside traditional SERP data
Weekly review routine: Collect data Monday, detect anomalies Tuesday, analyze root causes Wednesday, plan actions Thursday, implement and annotate Friday
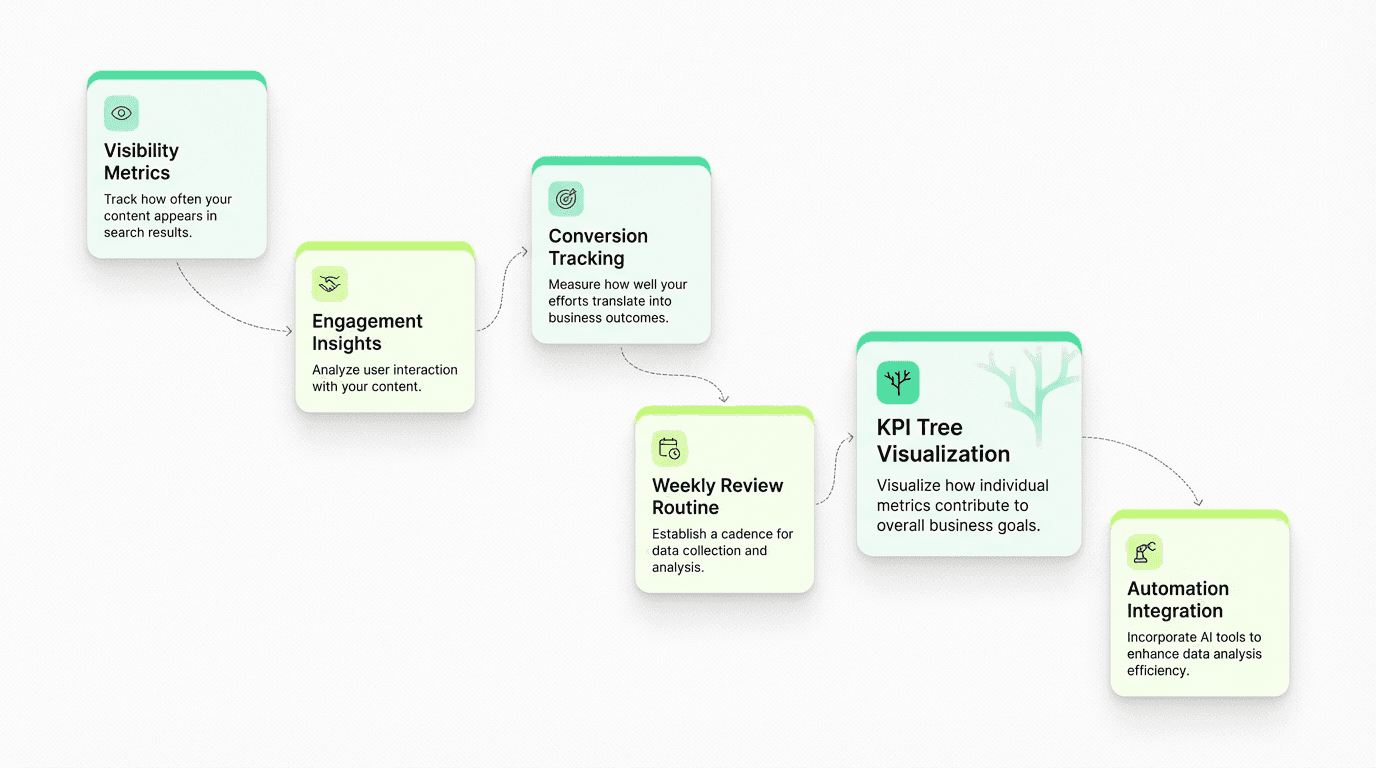
Build a KPI tree to visualize how lower-level indicators (impressions, CTR, conversion rate) roll up into business outcomes (revenue, leads, signups)
Marketing agents automate the entire review process: Platforms like Metaflow pull data from multiple APIs, detect anomalies, generate natural-language summaries, and deliver insights to Slack/email—your team reviews insights, not spreadsheets
Align key performance indicators with business goals: E-commerce tracks revenue, SaaS tracks trial signups, lead-gen tracks MQLs—every primary KPI should be a business outcome
Avoid common pitfalls: Don't track too many indicators, segment your data, annotate changes, account for seasonality, and fix funnel bottlenecks in order
If you're still measuring success by keyword rankings alone, you're navigating with a broken compass. The reality? SEO KPIs need to tell a complete story—from how visible you are in search to how many customers you're actually acquiring. In 2026, that story has become even more complex with the rise of AI-powered search experiences, making traditional approaches only part of the equation.
This guide will walk you through building a comprehensive framework that connects visibility to revenue, complete with dashboard templates, review routines, and the AI-search performance indicators you can no longer afford to ignore.
Why Traditional Measurement Falls Short
For years, teams have obsessed over rankings. "We're #3 for our target keyword!" sounds impressive in a meeting—until you realize that position drives minimal traffic, converts poorly, or worse, ranks for a query that doesn't align with buyer intent.
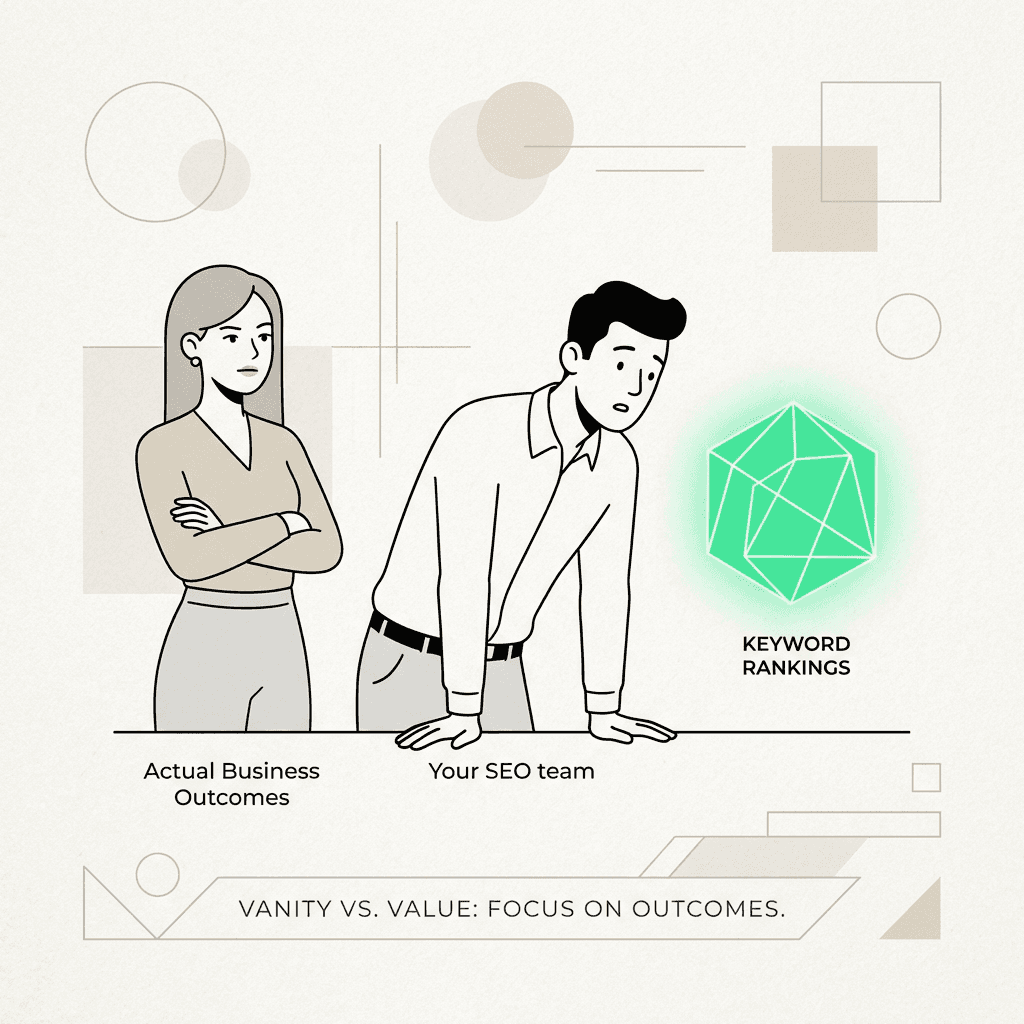
Rankings are a vanity metric. They're volatile, personalized, and increasingly fragmented across traditional search engines, AI Overviews, and conversational platforms like ChatGPT and Perplexity. A keyword might rank #1 on Google but never appear in an AI-generated answer, effectively making it invisible to a growing segment of users.
The shift toward reporting that matters requires measuring outcomes, not just outputs. That means tracking the full funnel: visibility → traffic → engagement → conversion → revenue. Only then can you calculate meaningful ROI and justify continued investment.
The Three-Tier Framework for Search Engine Optimization
A robust report should be organized into three layers, each serving a distinct purpose:
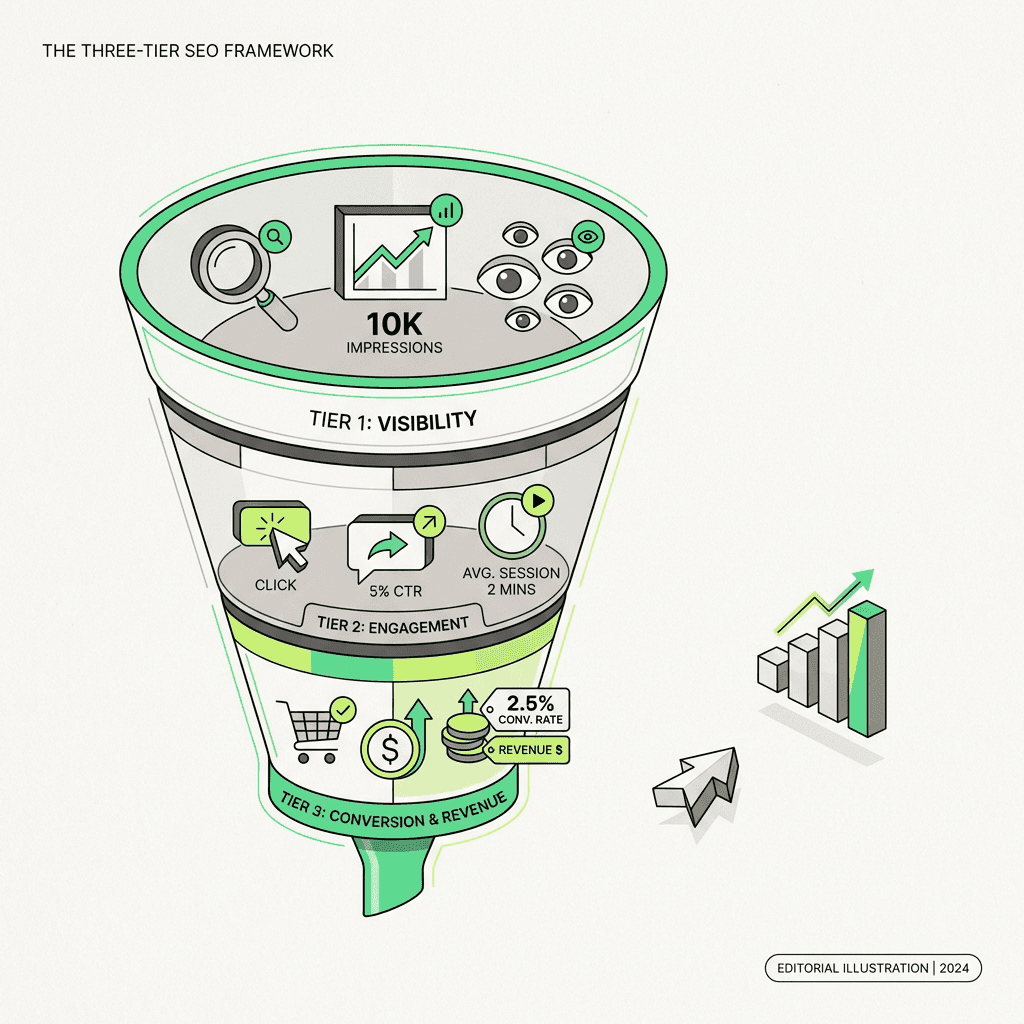
Tier 1: Visibility Indicators (Top of Funnel)
These indicators
Are we showing up where our audience is searching?
Traditional SERP Visibility:
Impressions: How many times your pages appeared in search results
Average position: Your typical ranking across tracked queries
Share of voice: Your visibility compared to competitors for target keywords
Featured snippet ownership: How many position-zero results you control
AI-Search Visibility (The New Frontier):
Citation frequency in AI Overviews: How often your content is referenced in Google's AI-generated summaries
AEO visibility scores: Your presence in answer-engine results (Perplexity, ChatGPT, Gemini)
Referral traffic: Sessions originating from conversational platforms
Entity recognition strength: How confidently systems associate your brand with relevant topics
The inclusion of AI-search performance tracking is no longer optional. As search behavior fragments across platforms, traditional organic search traffic indicators tell only half the story. If your content isn't optimized for Answer Engine Optimization (AEO), you're invisible to users who never click through to traditional search results. Leveraging ai workflows for growth can help ensure your content gains visibility in both traditional and AI-driven search experiences.
Tier 2: Engagement Indicators (Middle of Funnel)
These indicators
Are visitors finding what they need?
Sessions: Total visits from search (segmented by traditional vs. referrals)
Clicks and CTR: The relationship between impressions and actual visits
Pages per session: Depth of engagement with your content
Average session duration: Time spent indicates content relevance
Bounce rate / Engagement rate: Whether visitors immediately leave or interact
Scroll depth: How far users read your content (critical for long-form pieces)
The classic triumvirate of impressions clicks CTR remains foundational, but context matters. A 2% CTR might be excellent for an informational query but disastrous for a high-intent commercial search. Segment your data by query intent (informational, navigational, commercial, transactional) to set appropriate benchmarks. Advanced teams may benefit from using ai productivity tools for marketing to automate the segmentation and analysis process.
Tier 3: Conversion & Revenue Indicators (Bottom of Funnel)
These indicators
Are our efforts contributing to business goals?
Goal completions: Newsletter signups, demo requests, account creations
E-commerce transactions: Direct purchases attributed to search
Assisted conversions: The role in multi-touch attribution
Revenue: Total value generated by search traffic
Customer acquisition cost (CAC): Cost to acquire a customer through search
Customer lifetime value (CLV): Long-term value of customers acquired via search
This is where you prove ROI. If you're spending $10,000/month on content and technical optimization but generating $50,000 in attributed revenue, you have a clear 5x return. Without tracking these bottom-funnel indicators, search remains a cost center rather than a growth driver. Utilizing the right ai marketing automation platform ensures these figures are tracked accurately and efficiently.
Building Your Dashboard: Templates and Tools
An effective dashboard should be scannable, actionable, and tailored to your audience. Executives need different views than content teams. Here are important examples to help you get started.
Executive Dashboard (Monthly Review)
Key Indicators:
Total revenue (month-over-month change)
Sessions and conversion rate
Top 10 revenue-generating pages
ROI calculation
Year-over-year growth trends
Visualization: Use line graphs for trends, bar charts for top performers, and a single prominent ROI metric at the top.
Team Dashboard (Weekly Review)
Key Indicators:
Impressions, clicks, CTR (week-over-week)
Average position for priority keywords
New/lost featured snippets
Pages with declining traffic (requires investigation)
Technical health score (Core Web Vitals, crawl errors)
Citation frequency (if measurable via third-party tools)
Visualization: Combine tables for detailed data with sparklines showing trends. Use color coding (red/yellow/green) to highlight issues requiring immediate attention.
Content Team Dashboard (Real-Time)
Key Indicators:
Top-performing content by traffic and engagement
Content gaps (queries you're not ranking for)
Engagement (scroll depth, time on page)
Internal link opportunities
Content refresh priorities (pages with declining performance)
Visualization: Focus on actionable lists and heatmaps showing performance distribution across your content library. Employing a no-code ai workflow builder can streamline the creation and maintenance of these dashboards for content teams.
The Weekly Review Routine
Consistency beats intensity. A disciplined weekly review prevents small issues from becoming catastrophic drops and helps improve results over time.
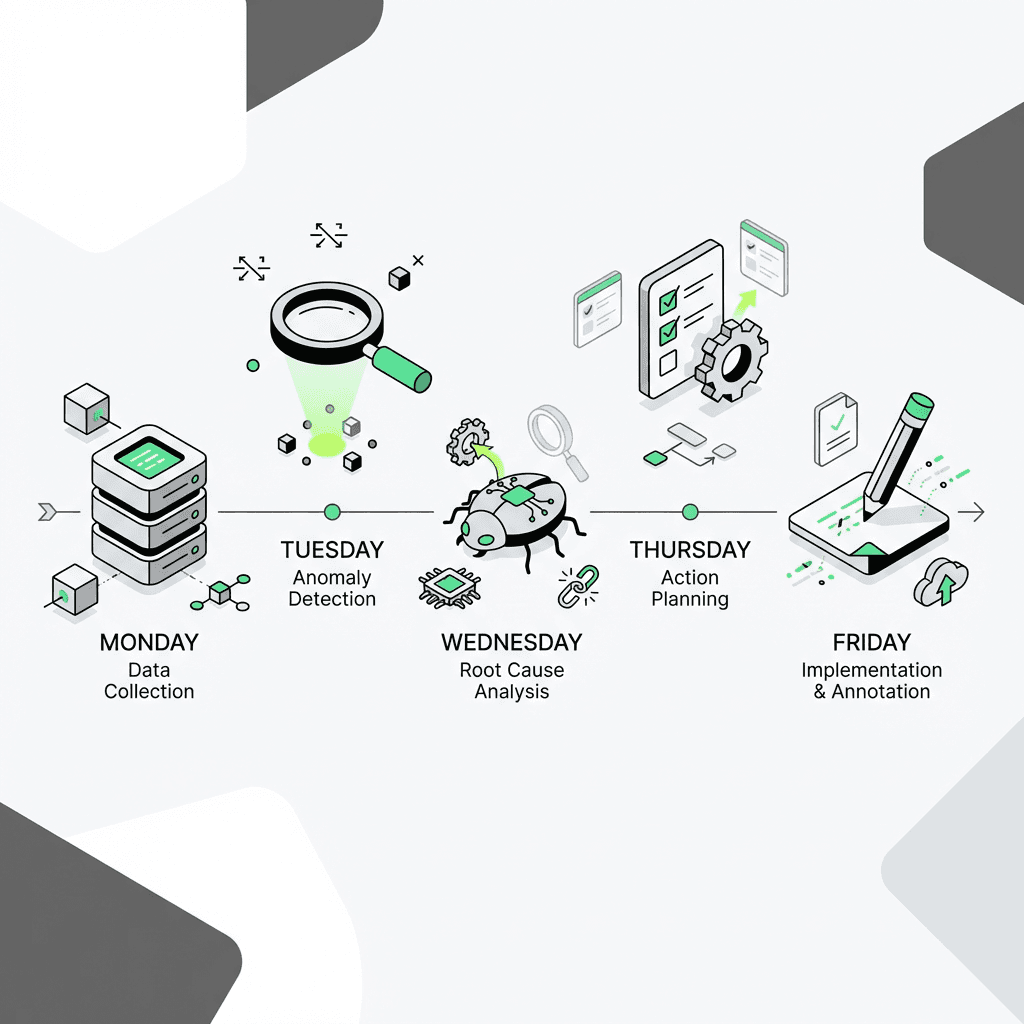
Monday: Data Collection
Pull fresh data from:
Google Search Console (impressions, clicks, CTR, position)
Google Analytics 4 (sessions, conversions, revenue)
Rank tracking tools (position changes for priority keywords)
AI-search monitoring tools (if available)
Tuesday: Anomaly Detection
Look for:
Pages with >20% traffic drops week-over-week
Sudden ranking losses for priority keywords
CTR declines (may indicate SERP feature changes)
Conversion rate shifts (could signal UX issues)
Wednesday: Root Cause Analysis
For each anomaly, investigate:
Did Google release an algorithm update?
Did a competitor publish superior content?
Are there technical issues (slow load times, broken links)?
Did SERP features change (new featured snippet, AI Overview)?
Thursday: Action Planning
Prioritize fixes:
Critical issues (revenue-impacting pages)
High-opportunity wins (pages on page 2 that could reach page 1)
Content refreshes (outdated information, improved depth)
Technical optimizations (Core Web Vitals, mobile usability)
Friday: Implementation & Annotation
Execute top priorities and add annotations in Google Analytics for:
Content publishes and updates
Website redesigns or migrations
Major algorithm updates
Marketing campaigns that might affect traffic
Annotations are your future self's best friend. Six months from now, when you're investigating a traffic spike, you'll thank yourself for noting the content refresh or product launch that caused it.
Advanced: Querying Data with BigQuery
For teams with significant data volume, Google Analytics 4's BigQuery export enables sophisticated analysis impossible in the standard interface. This is an important tool for understanding performance at scale.
Example: Purchase Events from Search Traffic
This query calculates total purchases, revenue, and average order value from search traffic for February 2026.
Example: Top Landing Pages by Conversion Rate
This identifies your highest-converting landing pages, helping you understand which content types and topics drive revenue.
How AI Is Transforming Measurement
The emergence of AI-powered search experiences—Google's AI Overviews, ChatGPT's SearchGPT, Perplexity, and others—demands an expanded framework.
New Indicators for the AI Era
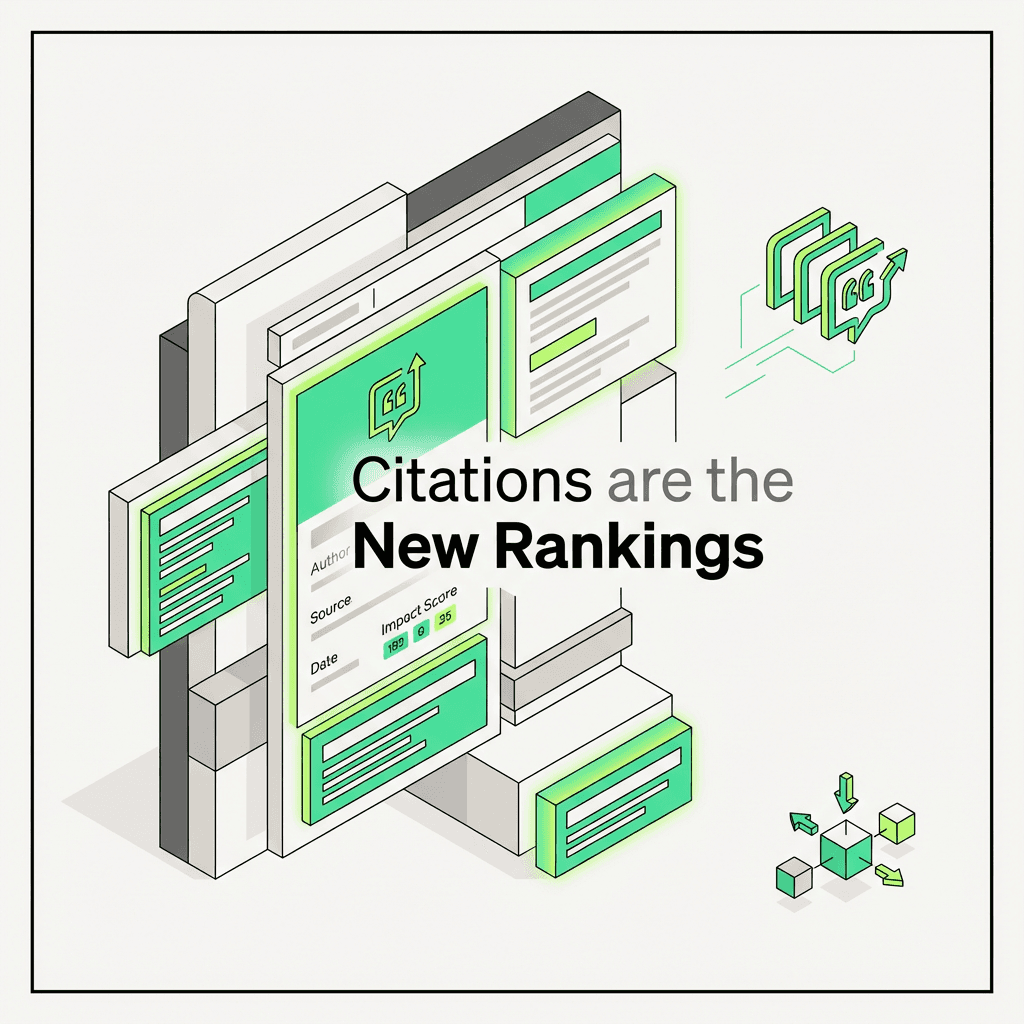
Citation Tracking: When systems generate answers, they cite sources. Being cited is the new "ranking #1." Track how often your content appears as a source in AI-generated responses.
Zero-Click Attribution: Answers often satisfy queries without requiring a click. Traditional traffic tracking misses this "dark visibility." Consider brand lift studies and direct traffic increases as proxies for AI-driven awareness.
Conversational Query Performance: AI search encourages longer, more natural queries. Optimize for question-based and conversational keywords, and track performance separately from traditional short-tail terms.
Entity Authority: Systems rely on entity recognition. Track your brand's association strength with relevant topics using tools that measure knowledge graph presence and entity relationships. Monitor domain authority and backlinks as signals of entity strength. In this environment, ai agents for marketing can be deployed to monitor and enhance your entity authority in real time.
The Metaflow Advantage: Marketing Agents for Search
Here's where the manual weekly review process gets dramatically more efficient. Traditional reporting requires hours of data pulling, spreadsheet wrangling, and manual analysis. AI marketing agents change the equation entirely.
Imagine an ai workflow automation workflow that:
Automatically pulls data from Google Search Console, Google Analytics, rank trackers, and monitoring APIs every Monday morning
Detects anomalies using statistical models that understand your baseline performance and flag meaningful deviations
Generates natural-language summaries explaining what changed, why it likely happened, and what actions to consider
Delivers insights directly to Slack or email in a format your team can immediately act on—no spreadsheet archaeology required
This is precisely what best ai tools for marketing built on platforms like Metaflow enable. Unlike rigid automation that simply moves data around, Metaflow's natural language ai agent builder allows growth teams to design intelligent workflows that reason about data, not just report it.
The platform functions as an ai workflow builder and no-code agent builder that unifies ideation and execution. Instead of fragmented tools—one for data extraction, another for analysis, a third for reporting—Metaflow brings the entire workflow into a single workspace. You describe what you want in plain language, the agent handles the complexity, and your team reviews insights instead of raw data.
For search specifically, this means:
Weekly review agents that summarize performance and flag issues
Content opportunity agents that identify gaps and suggest topics based on search data
Competitive monitoring agents that track rival content and rankings
Technical agents that monitor website health and alert on critical issues
The cognitive bandwidth reclaimed by automating rote analysis can be redirected toward high-impact strategic work: content ideation, user experience improvements, and cross-channel integration.
Creating Your KPI Tree: A Practical Example
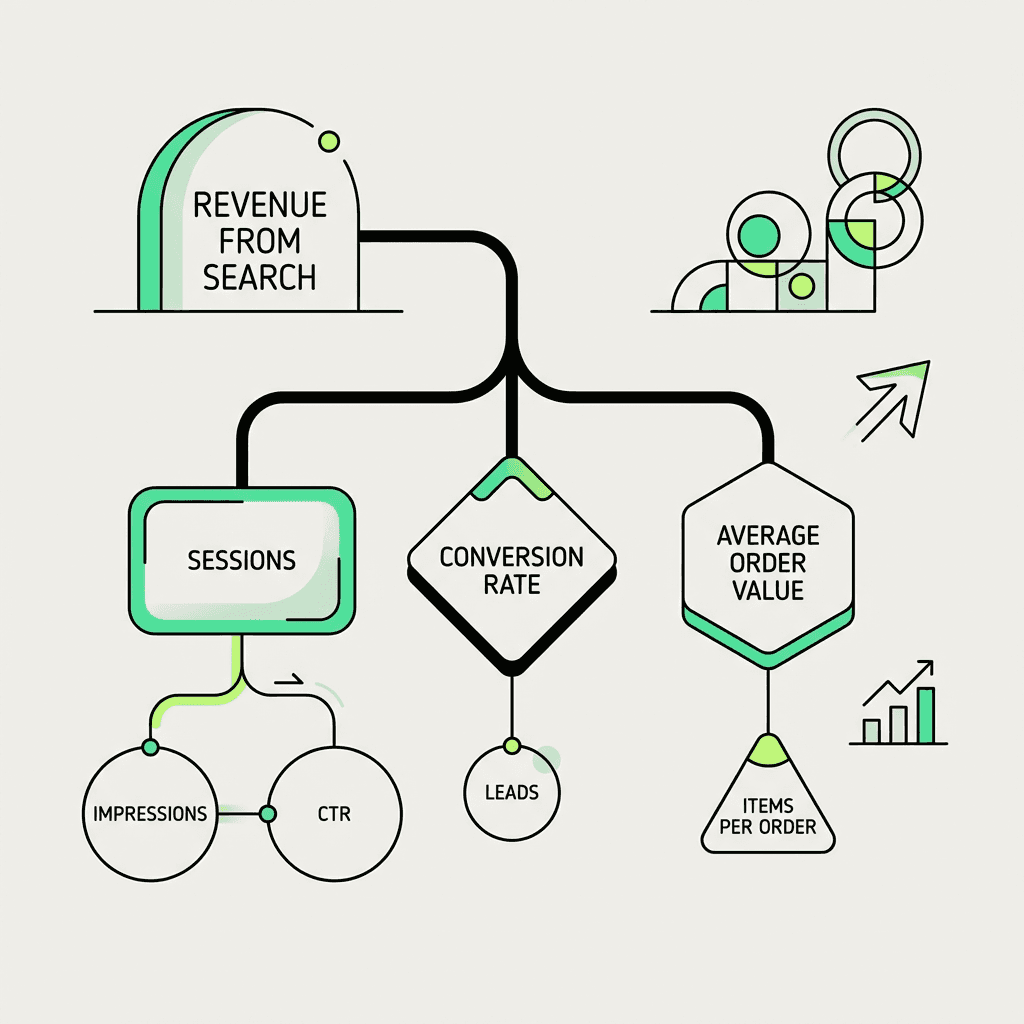
A KPI tree visualizes how lower-level indicators roll up into business outcomes. Here's a simplified example for an e-commerce website:
This tree makes dependencies explicit. If revenue drops, you can trace the issue: Is it fewer sessions (traffic problem), lower conversion rate (UX problem), or reduced order value (product/pricing problem)? Each branch points to specific optimization opportunities.
Aligning Key Performance Indicators with Business Outcomes
The ultimate test of any metric: Does it connect to a business goal?
For E-commerce
Primary KPI: Revenue from search
Secondary KPIs: Conversion rate, AOV, CAC via search
For SaaS
Primary KPI: Free trial signups from search
Secondary KPIs: Trial-to-paid conversion rate, CAC via search, CLV of customers
For Lead Generation
Primary KPI: Marketing Qualified Leads (MQLs) from search
Secondary KPIs: Lead-to-customer rate, cost per lead, pipeline value
For Publishers and Blog Sites
Primary KPI: Ad revenue from search traffic
Secondary KPIs: Pageviews per session, ad viewability, RPM (revenue per thousand impressions)
Notice how each primary KPI is a business outcome, not a search-specific metric. This alignment is what transforms search from a technical function into a recognized growth driver and helps demonstrate success to stakeholders.
Common Pitfalls to Avoid
Pitfall 1: Tracking Too Many Indicators
More data doesn't mean more insight. Focus on 5-10 core indicators that directly inform decisions. Everything else is noise.
Pitfall 2: Ignoring Seasonality
E-commerce traffic spikes in Q4. B2B often slows in summer. Compare year-over-year, not just month-over-month, to avoid false alarms.
Pitfall 3: Failing to Segment
Aggregate data hides problems. Segment by device, geography, landing page type, and traffic source to identify specific issues.
Pitfall 4: No Annotation Discipline
If you don't document changes (content updates, website migrations, campaigns), you'll waste time investigating "mysterious" traffic shifts that have obvious causes.
Pitfall 5: Optimizing for the Wrong Stage
Driving more top-of-funnel traffic is pointless if your conversion rate is terrible. Audit the full funnel and fix bottlenecks in order to improve overall results.
The Future of Measurement
As search continues to fragment across traditional search engines, assistants, and voice interfaces, frameworks will need to evolve further. Expect to see:
Multi-platform attribution models that credit search for awareness generated in AI Overviews even when the conversion happens via direct traffic later
Intent signal tracking that measures not just what users search for, but the context and intent behind queries
Real-time competitive intelligence powered by ai agents that continuously monitor rival content and rankings
Predictive indicators that forecast future performance based on leading signals (e.g., indexation rate predicting traffic growth)
The teams that thrive will be those who balance timeless principles (measure outcomes, not outputs) with adaptation to new search paradigms (visibility, conversational queries, entity authority).